Table of Contents
You Can’t Scale What You Can’t See: Telemetry‑first Video Calls with Prometheus, Grafana, and NATS
Real‑time video fails at the edges—jitter, latency spikes, dropped packets. To scale videocall.rs, the metrics must be objective and actionable. In two weeks we went telemetry‑first: client instrumentation → NATS → metrics-api → Prometheus → Grafana. No wishful thinking. No vanity graphs.

Executive Summary
- I can now assess the health of a video call in under 30 seconds and wether the call was affected by a network or client issue or not.
- Clients report health metrics over NATS. i.e: RTT, audio and video packets buffered, etc.
- A compact
metrics-apithat fans in client health over NATS and exposes/metricsfor Prometheus. - Grafana panels for health/RTT/session quality—with labels kept on a leash to avoid cardinality blowups.
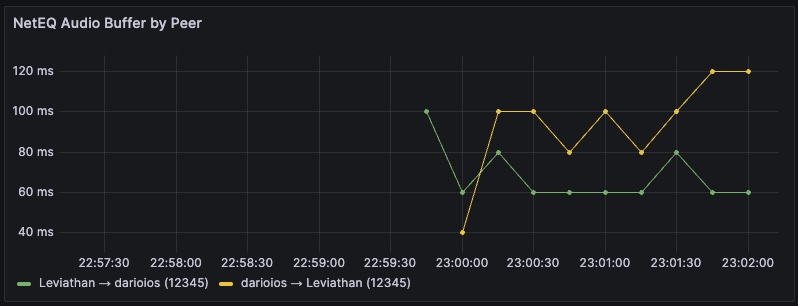
NetEQ buffer size per peer — effectively receive‑side lag: how many audio packets are currently buffered before playback.
The moment guessing stopped
It clicked on a late‑night call with Seth Reid and the Fame team in the Philippines. Two continents, three time zones. We were pushing a new build, trying to understand why the experience felt “a beat behind” on their side. My notebook had quotes like “a little laggy here” and “fine on my end now,” which is to say: nothing you can chart.
Seth did what good CEOs do in hard mode: stayed calm, precise, and relentlessly constructive. He kept the room focused—“Show me what matters and we’ll push again.” We needed objective truth, not adjectives.
We needed objective truth, not adjectives. Seth Reid, CEO of Fame
That night turned the monitoring plan from nice‑to‑have into ship‑it‑now. Client‑measured RTT to the elected server gave us the real latency story. NetEQ buffer depth showed when audio was on the edge of concealment. Once those numbers landed on a Grafana panel, the conversation switched from feels to facts:
p95 RTT sits at 280–320 ms in APAC; NetEQ expands 15–25 ops/sec during spikes. Pin APAC, retry.
We tightened the loop, re‑tested, and the graphs moved the right way. Seth made it easy to do the right engineering thing—ask for the truth and keep shipping until you get it.
What matters to engineers
Outcomes first
- Detect client‑perceived degradation in under 30 seconds, isolate by region/server, quantify blast radius.
- Keep time‑series cardinality bounded so the system stays fast and cheap.
Primary signals (in order)
- Client RTT to elected server (p50/p95/p99).
- NetEQ buffer depth and concealment/acceleration ops.
- Population: sessions, participants, peer connections.
Architecture slice
- Client diagnostics → health reporter → NATS fan‑in →
metrics-api→ Prometheus → Grafana.
- Client diagnostics → health reporter → NATS fan‑in →
Label discipline
- Only bounded labels:
meeting_id,session_id,peer_id,server_url,server_type. - No IPs, UAs, or free‑form text in labels.
- Only bounded labels:
30‑second triage
- Check RTT SLO; if p95 spikes, pivot by server_type/server_url.
- If RTT is flat but audio is bad, scan NetEQ buffer/ops (loss/jitter).
- Cross‑check population to size blast radius.
Minimal dashboards
- RTT SLOs, NetEQ Health, Participation/Connections.
The Role of NATS (the nervous system)
- Subjects
- Room:
room.{room}.*(queue groups per session) - Health fan‑in:
health.diagnostics.{region}.{service_type}.{server_id}
- Room:
- Why it works here
- Pub/sub + queue groups → load distribution and backpressure without bespoke brokers.
- Gateways bridge regions; add JetStream if durability is needed later.
Automated, repeatable deploys with Helm + GitHub Actions
Single-switch releases: Helm charts standardize manifests and values across regions so one trigger applies the same contract everywhere.
Strategies by intent: Choose blue‑green, canary, parallel, or single‑region at run time to tune risk versus speed.
Built-in safety: Dry‑run, restart‑only, health gates, certificate checks, and a concise deployment report so “green” actually means ready.
Cross‑region aware: Validates NATS in both clusters and pivots by
regionduring verification.One source of truth: Infra and app move together via charts—no snowflake steps.
Workflow: Orchestrated by the
helm-deploy.ymlworkflow—plans, deploys, validates, and notifies.- Workflow file: helm-deploy.yml
- Charts: in‑repo configs for monitoring and ops
Hard‑won lessons
- Automate everything repeatable—deployments, health checks, certificate validation, and reporting. Humans decide; systems execute.
- Delete stale series or your p95 is fiction.
- Client RTT is the truth source for UX: as it grows, the user experience deteriorates.
- Bound labels; put unbounded data in logs.
- Default for your smallest cluster (scrape interval, retention, resources); scale up later.